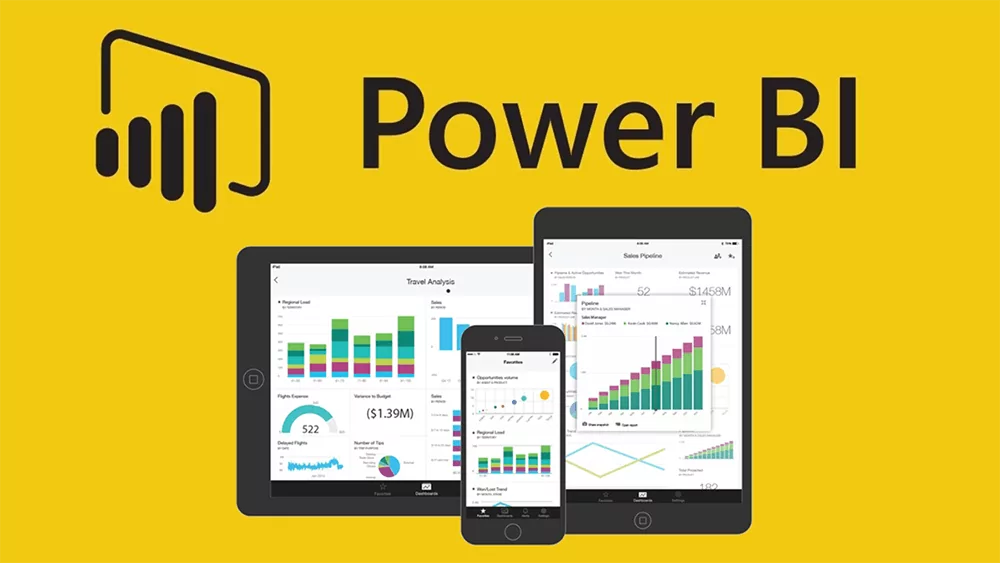
Unlock the power of Power BI to create interactive dashboards and reports! This beginner-friendly course is designed for anyone who wants to learn how to transform raw data into meaningful insights using Microsoft Power BI.
By the end of this course, students will be able to connect to data sources, clean and model data, and create stunning visualizations to tell compelling data stories.
The Power BI for Beginners course is perfect for learners who are new to Power BI and want to:
✔ Understand Power BI’s interface and core functionalities.
✔ Connect to multiple data sources (Excel, SQL, web data, etc.).
✔ Clean and transform data using Power Query.
✔ Create dynamic dashboards using visuals, slicers, and filters.
✔ Use DAX (Data Analysis Expressions) for calculations and measures.
✔ Publish & share reports for business intelligence.
At the end of the course, students will build their own Power BI dashboard project and receive a certificate of completion!
To participate in this course, students will need:
✔ A laptop with Power BI Desktop installed (free version available).
✔ Internet access for live virtual sessions.
✔ Basic familiarity with Excel is recommended but not required.
🔹 Understanding Business Intelligence (BI).
🔹 Exploring the Power BI interface & features.
🔹 Importing data from Excel & other sources.
🔹 Using Power Query to clean & reshape data.
🔹 Handling missing values & duplicates.
🔹 Merging & appending datasets.
🔹 Understanding relationships in Power BI.
🔹 Creating calculated columns & measures.
🔹 Introduction to DAX (Data Analysis Expressions).
🔹 Creating interactive charts, tables, and maps.
🔹 Adding slicers & filters for better analysis.
🔹 Designing user-friendly dashboards.
🔹 Using SUM, COUNT, AVERAGE functions in DAX.
🔹 Creating calculated fields & advanced measures.
🔹 Using time intelligence functions.
🔹 Publishing reports to Power BI Service.
🔹 Setting up scheduled refresh for live data.
🔹 Sharing dashboards with stakeholders.
🔹 Building a complete Power BI dashboard.
🔹 Presenting insights & recommendations.
🔹 Course completion certificate.
✔ Learn to create professional BI dashboards.
✔ Transform raw data into interactive reports.
✔ Master Power Query, DAX, and data modeling.
✔ Publish and share insights with stakeholders.
✔ Earn a certificate upon completion!


For Add Course Review. You need to login first Login Here


.jpg)
Download our mobile app and learn on the go.


© 2026 Cedargrowth Consult. All Rights Reserved. Powered by JUSTIMAGIN
UpdatedNovember 2020
The skills you need to become a BI Analyst - Statistics, Database theory, SQL, Tableau – Everything is included
UpdatedNovember 2020
The skills you need to become a BI Analyst - Statistics, Database theory, SQL, Tableau – Everything is included
UpdatedNovember 2020
The skills you need to become a BI Analyst - Statistics, Database theory, SQL, Tableau – Everything is included
UpdatedNovember 2020
The skills you need to become a BI Analyst - Statistics, Database theory, SQL, Tableau – Everything is included
UpdatedNovember 2020
The skills you need to become a BI Analyst - Statistics, Database theory, SQL, Tableau – Everything is included